
Livelike Analytics Dashboard
What analytics does Livelike provide?
As soon as your integration with LiveLike is launched, we start collecting data that can be used to track your success. This data helps you understand your programs’ engagement performance and the usage behaviors of your audience. These understandings can be utilized to attain the most value out of the LiveLike product, resulting in increased participation, engagement, and retention.
There are three views as of now that are available in our analytics dashboard: Applications, Program, and Widget level information. These views have similar filters like organization and application names which can be used to set the filter according to their needs.
Application View
In the Application View, you can view various KPIs associated with your application as a whole on a time-period basis, and its performance on various user-level metrics.
Key features include:
- Spreadsheet download of the page contents with the current filters that have been applied.
- Search bar in the top right corner to increase efficiency.
- Share' next to the download button for better ease of access and shareability, allowing you to share the contents between your colleagues with the same filters which you have applied at your end.
You can see data in a more granular form, such as hour/day/week/month/year, by using the Interval drop-down options. Our default view option is by Month.
.gif")
Program View
In the Program View, you can see KPIs by Program ID, allowing for performance comparisons on a program over program basis. The filters remain the same which are already available in the application-level view previously selected. In this view, you can see Unique Impressions and Unique Interactions for each of your programs. Below is a snapshot of how it looks.

Also, please note that in the above views, Interactions are calculated for interactable widgets (discussed in the next view).
Widgets View
In the Widget View, you can see how individual interactive widgets have performed. Here, you can filter the contents, such as by Publish Date, Program ID, Widget Type. For instance, if you want to see performance individual widget level by a particular program, or on a particular date, you can filter for those use cases. We have added a new filter where you can choose from two widget categories - Interactive widgets & Non-Interactive widgets.

For your convenience, you can select a particular program, and then you can see the widgets which were published during that time frame. You can also download the contents of a particular program by clicking on the Download button provided in the upper right corner.
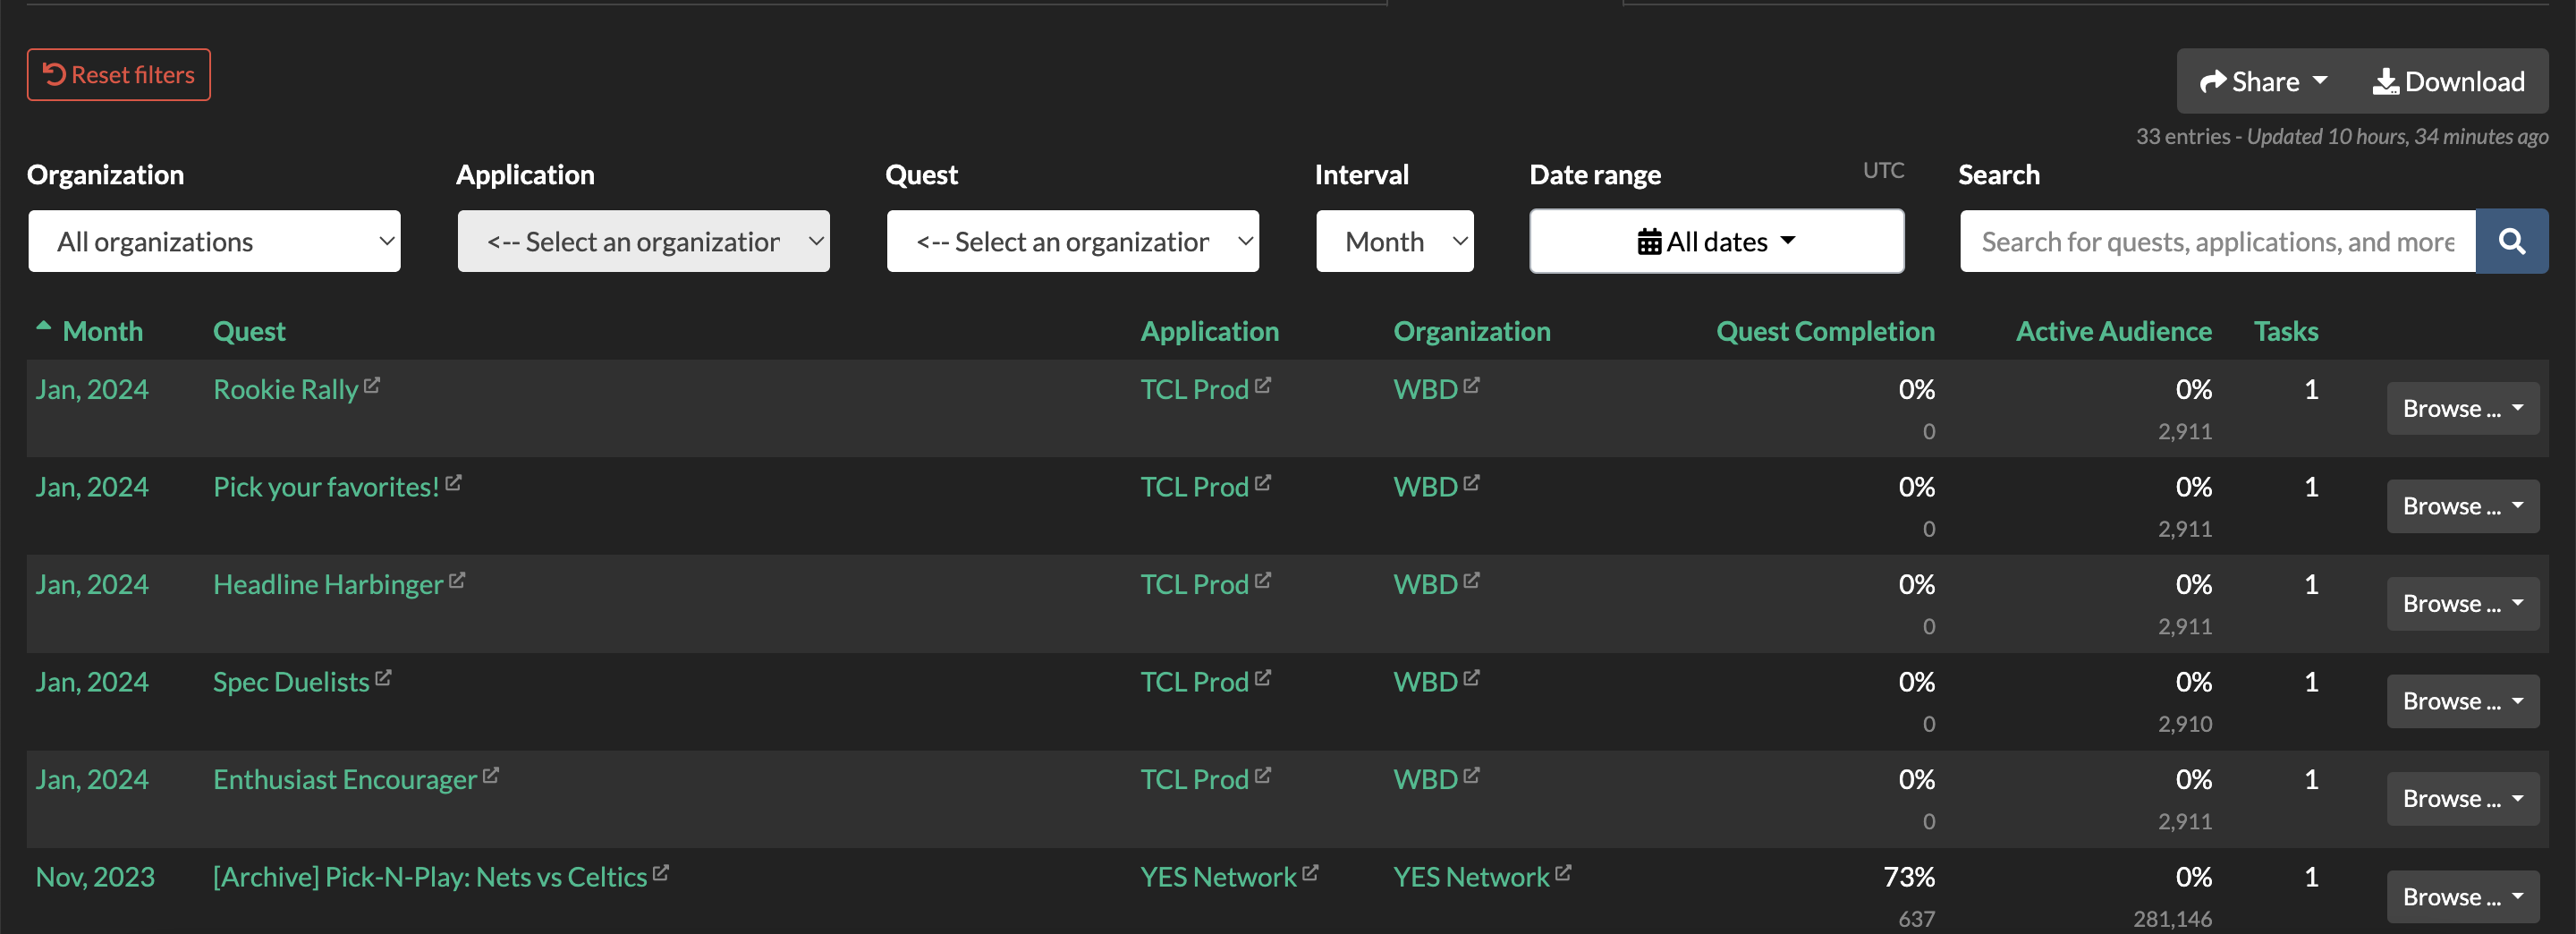
Quests View
In the Quest View, you can see the completion status and active users if individual quests. Here, you can filter the contents using Quest and rest of the filters remain the same which are already available in the application-level view.
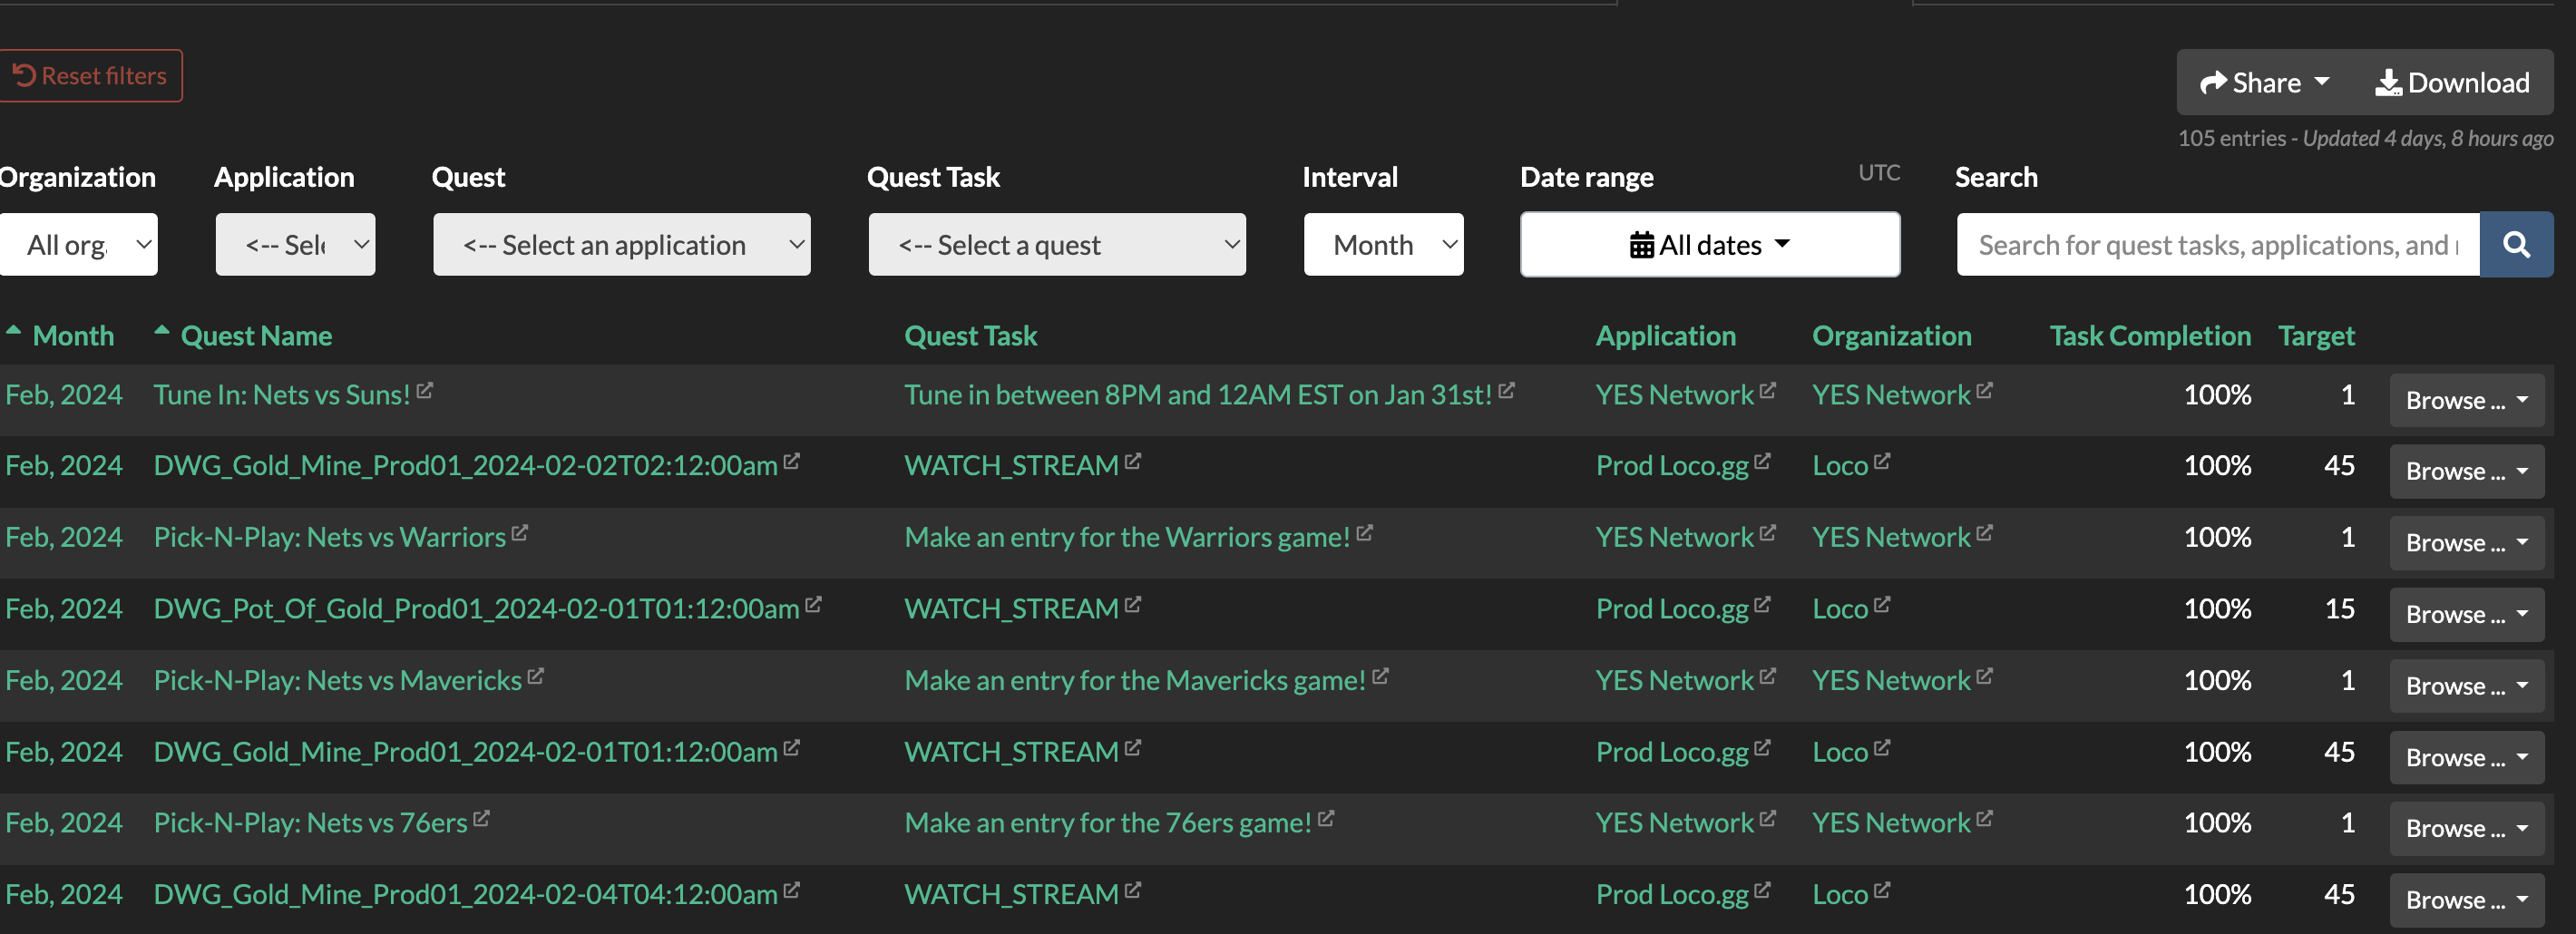
Quest Tasks View
In the Quest Task View, you can see the task name and completion status of individual quests. Here, you can filter the contents using Quest, Quest Task and rest of the filters remain the same which are already available in the application-level view.
Updated 3 months ago