

Analytics Dashboard
Standard Analytics Dashboard
The Standard Analytics dashboard is available to all customers directly in the Producer Site. LiveLike generates these reports automatically from your platform data, so you do not need to configure the dashboard before viewing them.
Application View
In the Application View, you can view various KPIs for your application over time. You can also track performance across user-level metrics.
Key features include:
- Use Download to export the page contents as a spreadsheet with your current filters applied.
- Use the search bar in the top right corner to find results faster.
- Use Share next to Download to share the current view with colleagues while keeping your applied filters.
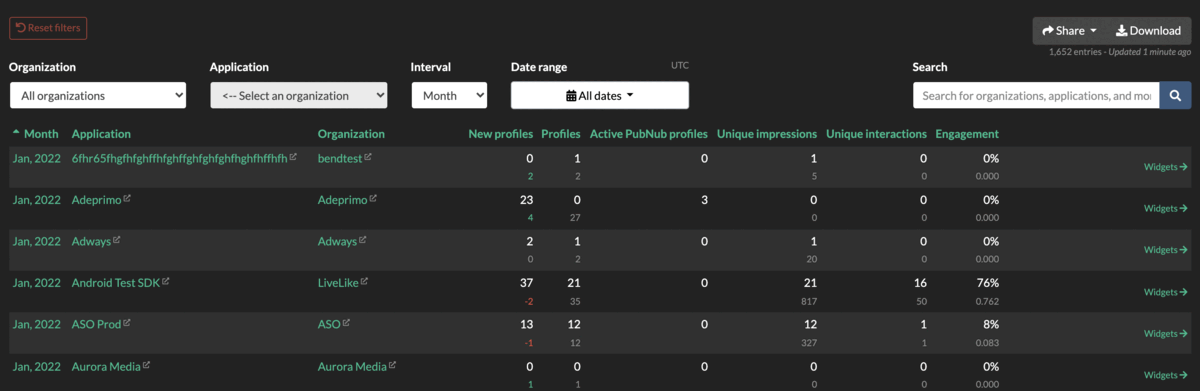
Use the Interval drop-down to switch between hour/day/week/month/year views so you can compare short-term spikes with longer-term trends. The default view is Month.
.gif")
Program View
The Program View shows KPIs per Program ID for side-by-side program comparisons. Each row lists Unique Impressions and Unique Interactions for one program. Filters carry over from the Application View.

Note: these views count interactions only for interactive widgets - covered in the next section.
Widgets View
The Widgets View shows how individual widgets have performed. Filter by Publish Date, Program ID, Widget Type, or Widget Category to narrow the results.
The Widget Category filter has two options:
- Interactive : polls, predictions, quizzes, and other widgets that produce interaction data.
- Non-Interactive : images, cheer meters, alerts, and other display-only widgets.
Use it to exclude display-only content from your engagement numbers. To see only the widgets from one program, filter by that Program ID.

Select a program to see the widgets published during that time frame. Download that program's contents from the Download button in the upper-right corner.
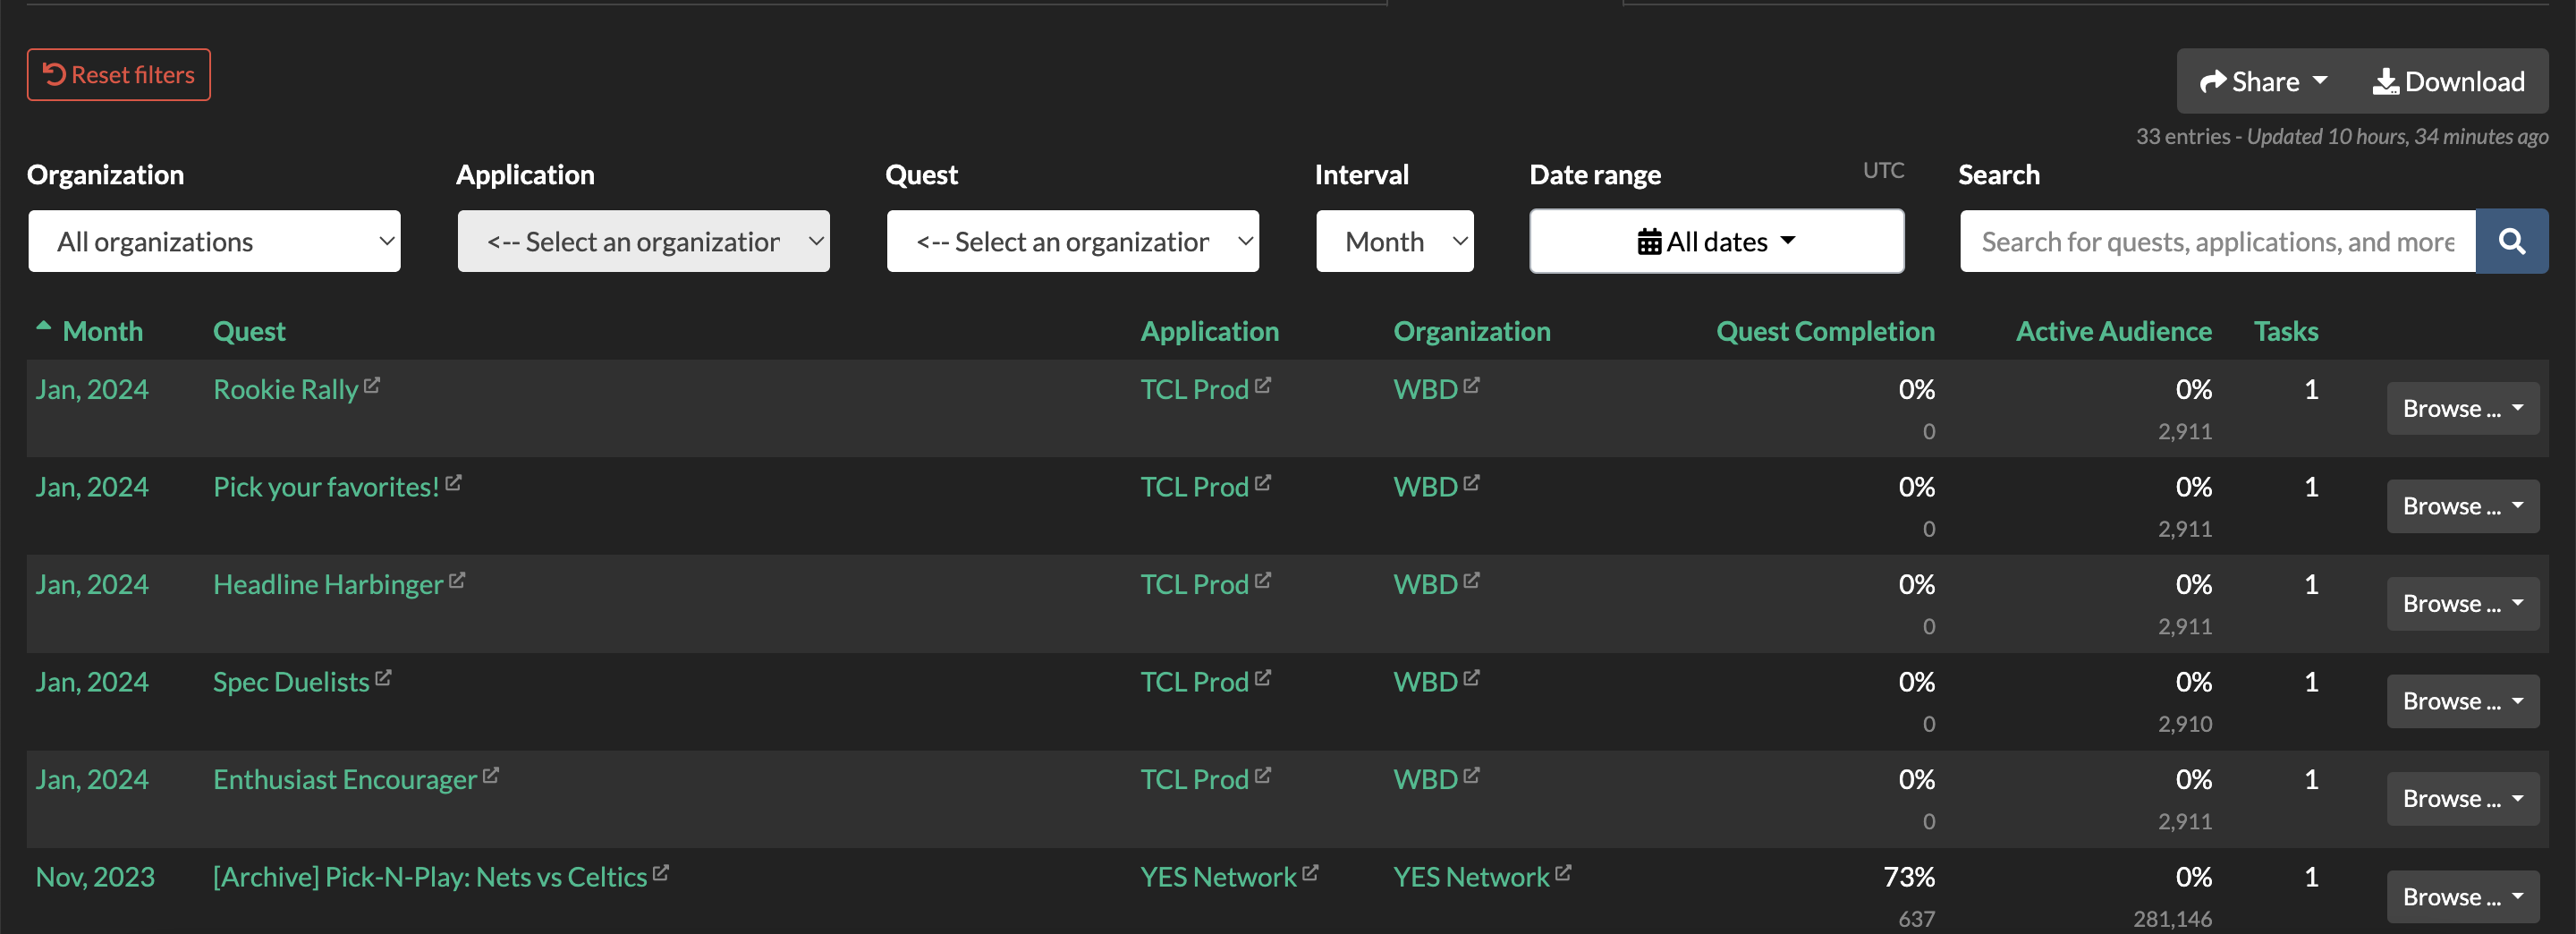
Quests View
The Quests View shows completion status and active-user counts per quest. Filter by Quest; all other filters carry over from the Application View.
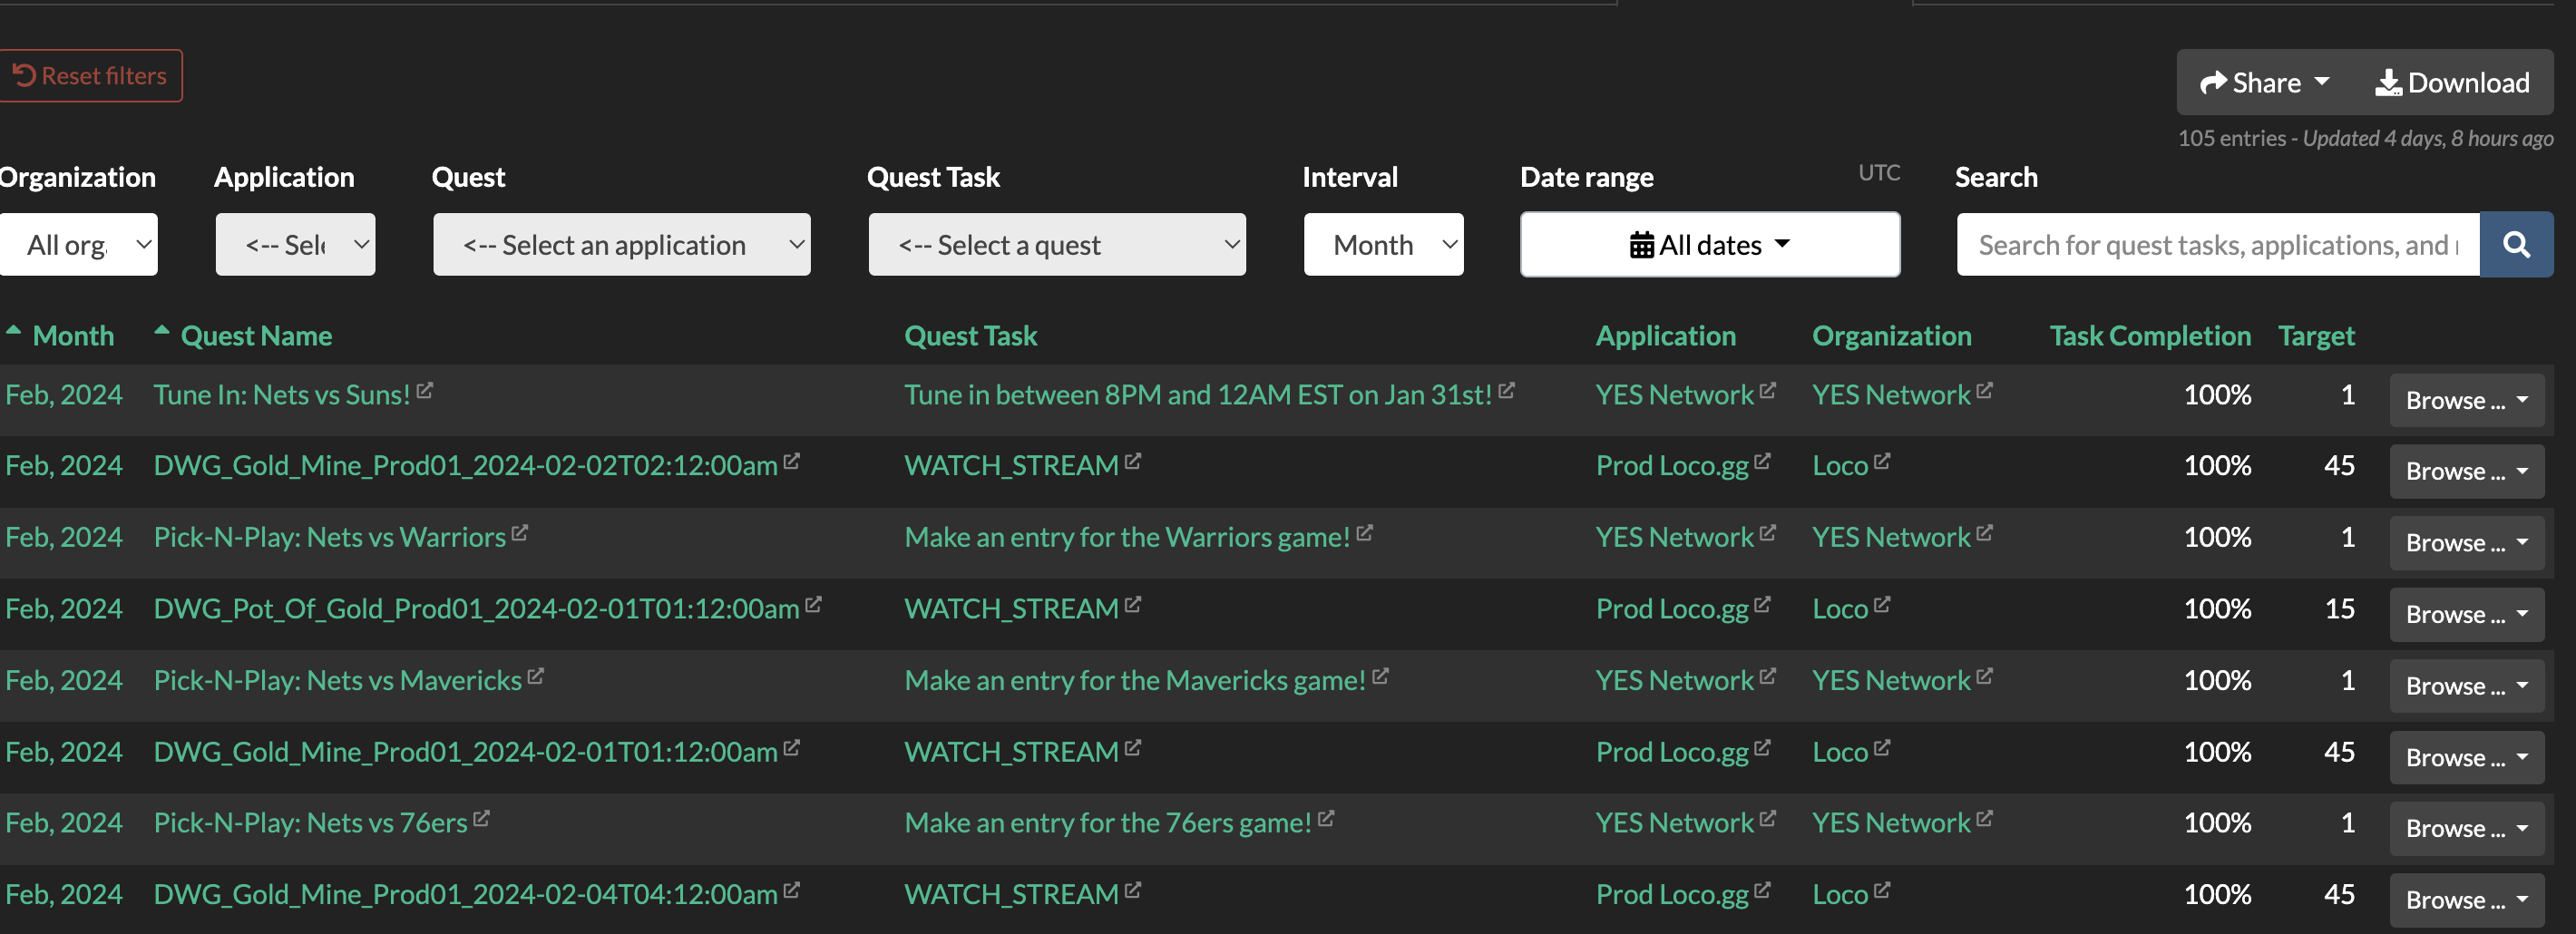
Quest Tasks View
The Quest Tasks View shows the task name and completion status for each quest. Filter by Quest and Quest Task; all other filters carry over from the Application View.
Visual Analytics
Visual Analytics provides an interactive data exploration experience embedded in the Producer Site. It is available as an add-on and offers richer, drill-down reporting across multiple dashboard tabs, including custom tabs configured for your specific product.
Default Dashboard Tabs
All Visual Analytics-enabled accounts include the following tabs:
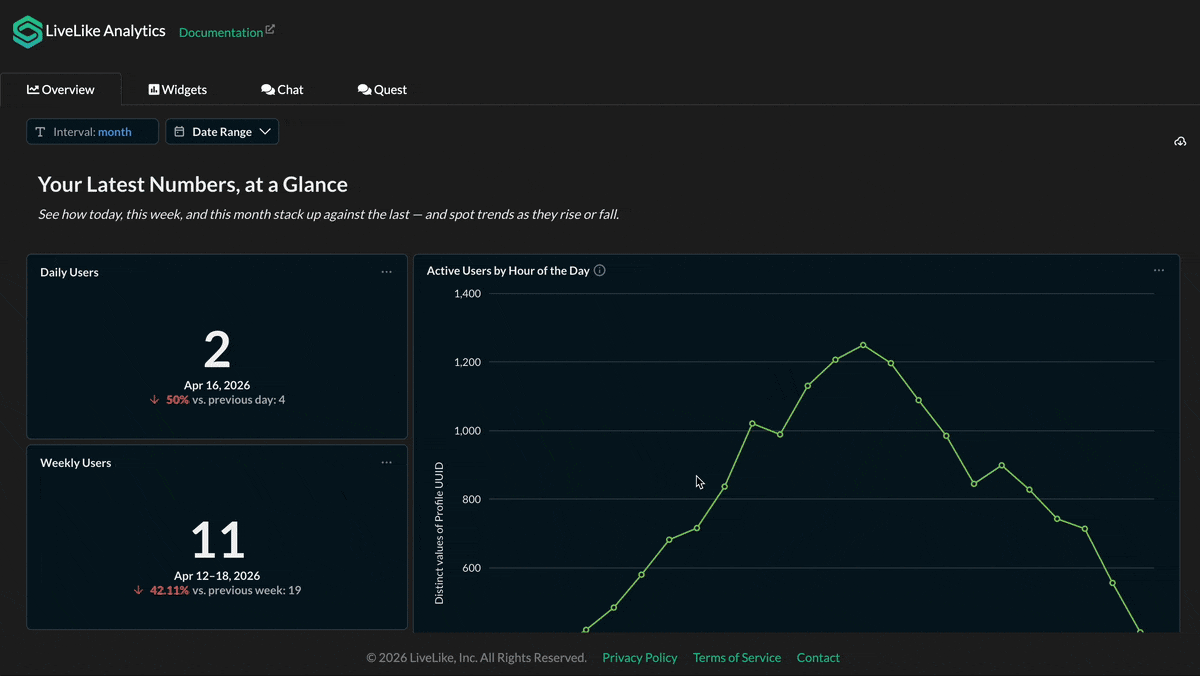
Overview
High-level engagement KPIs across your application - active users (DAU/WAU/MAU), trend lines, and an interval-level summary of profiles, impressions, interactions, and engagement percent. Your starting point for understanding overall platform health.
Widgets
Widget-specific performance broken down by type and program - engagement scores, widgets published by type, top-performing formats, and a per-widget statistics table with engagement rates.
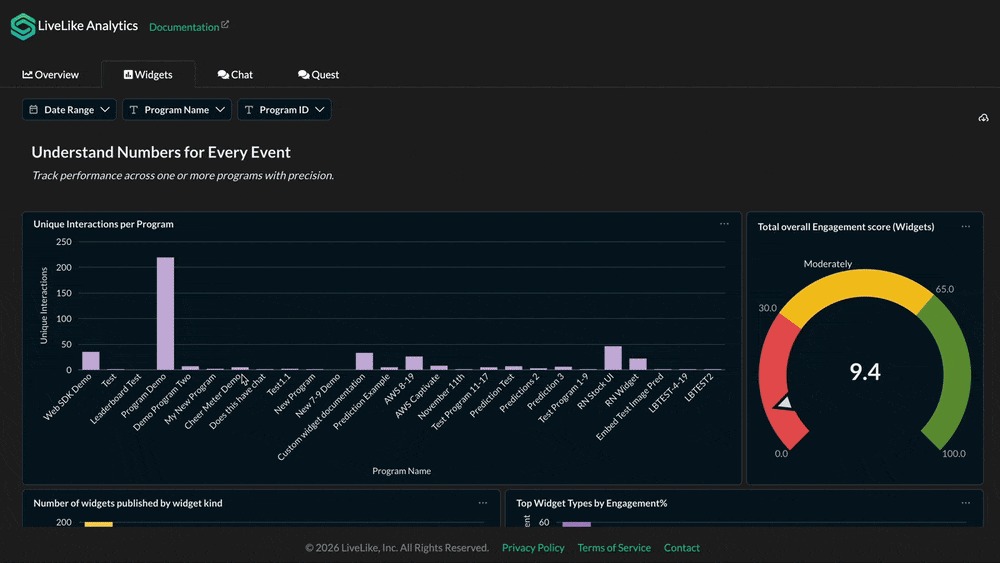
Tip: To find a Program ID: open the CMS, navigate to the program, click the three-dot menu (⋮), and select View Program ID.
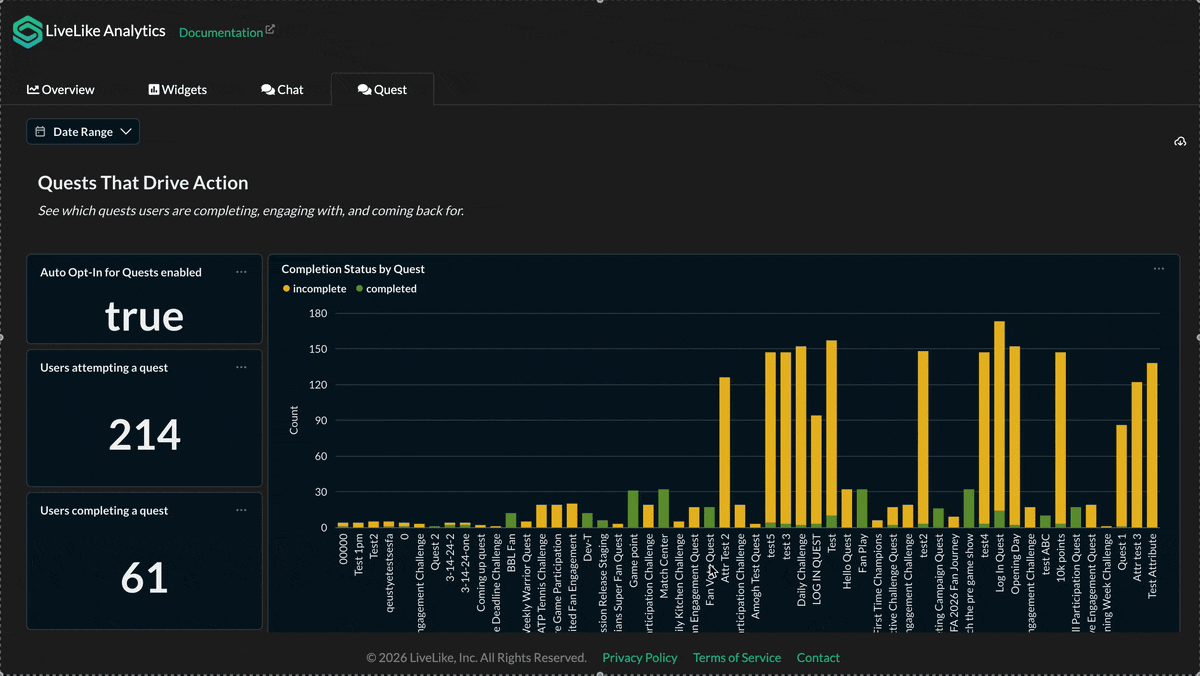
Quest
Quest participation funnels and reward claim data such as users attempting/completing quests, completion status by quest, per-quest funnel analysis, and average completion time.
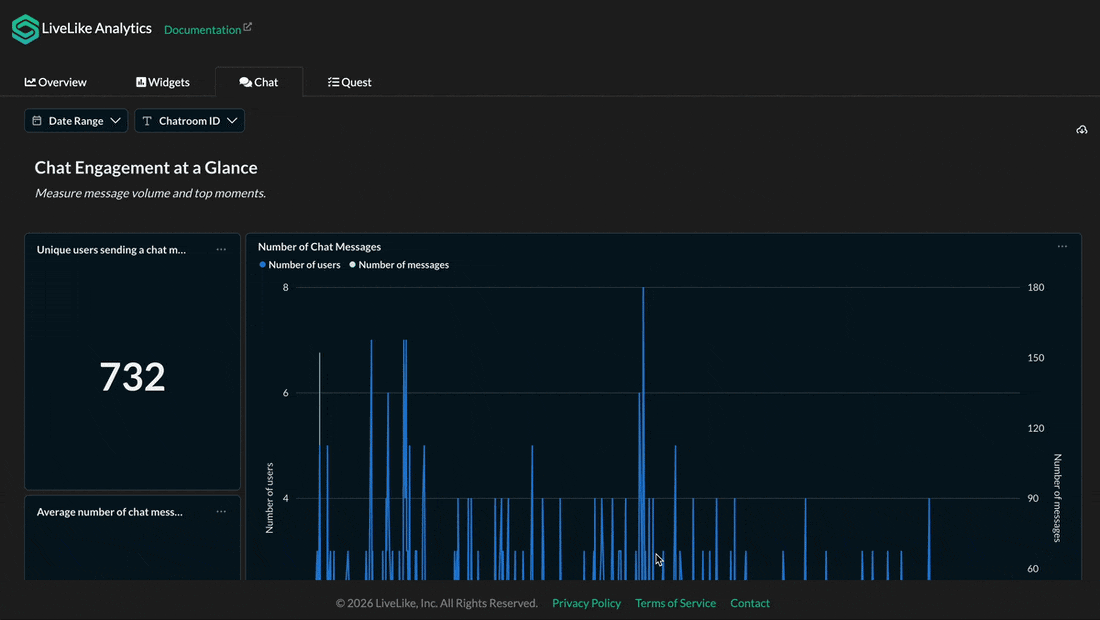
Chat
Message volume, user participation, and moderation activity - chat message trends, unique senders, average messages per user, moderation actions (shadow ban, read-only), system-filtered messages, and deleted messages.
Additional Tabs
Accounts may have additional tabs configured based on their product:
| Tab | What it covers |
|---|---|
| Comments | Comment volume, unique commenters, reply depth, and reaction trends |
| Leaderboard | Entry counts per leaderboard and detailed entry-level tables (Profile ID, Nickname, Score) |
| Streaks | Streak adoption, average/max streak lengths, milestone achievement rates, drop-off analysis, freeze usage, and reward redemption |
| Badges | Badges awarded by type, user badge grants, and distribution across badge tiers |
| Status Tiers | Tier distribution, upgrades/downgrades, and average time to tier (custom configuration) |
| Reward Store | Redemption volumes, points spent, per-SKU transaction trends, and transaction history |
For detailed metric definitions, see the Analytics Dictionary.
Tip: Custom tabs are configured per account. Contact your LiveLike account manager if you need additional views or metrics not listed here.
Arcade Analytics Tabs
For clients using LiveLike Arcade, additional tabs are available covering both Skilled and Non-Skilled game types. These tabs are configured per client and organisation.
Arcade Games (Overview)
A cross-game summary with three sections:
- User Funnel - total game plays, total distinct users, DAU, and game plays/users across days and per game
- Retention - D1 retention rates across games
- Score - average score per game
Arcade Games: Skill Based
In-depth analytics for skill-based games (e.g., skate-master, ski-dash, bobsleigh-battle, curling-master). Three sections:
- User Funnel - Total Distinct Users, MAU, Weekly Average Users, DAU
- Game Plays - Total Games Played, Average Monthly/Weekly/Daily Game Plays, game plays and distinct users per game and across days, user cohorts (0–30, 31–60, 61–90, 90+ days)
- Game Engagement - Max Score, Average Score, Completion Rate, average score per game, games played vs scores submitted over time
Arcade Games: Non-Skilled
Analytics for non-skilled game types. Same structure as Skill Based but without the Game Engagement section (no scores or completion rates):
- User Funnel - Total Distinct Users, MAU, Weekly Average Users, DAU
- Game Plays - Total Game Plays, Average Monthly/Weekly/Daily Games Played, average games played per user (total/monthly/weekly/daily), game plays and distinct users across days
Per-Game Dashboards
Individual game dashboards (e.g., Basketball, Charity Product) may be configured for clients with specific game types. These provide game-specific breakdowns of the same core metrics.
Custom Analytics
If a metric or dashboard view you need is not available in any of the dashboards, LiveLike can configure custom analytics dashboards tailored to your requirement. Custom tabs can include bespoke KPIs, audience segments, feature-specific funnels, or event groupings not covered by the default set.
To request custom analytics, contact your LiveLike account manager with a description of the metrics or views you need. The LiveLike team will assess feasibility and configure the custom tab for your organisation.